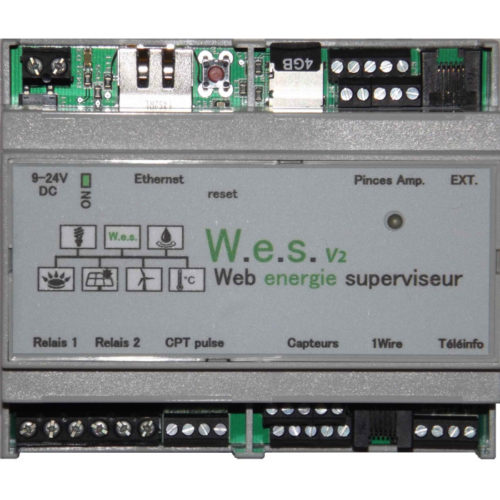
I've been using Cartelectronic's WES server for several years now. It's a small box that integrates into the electrical panel and is capable of monitoring all of the household's energy consumption, whether it's electricity via teleinfo or clamp meters, water, gas, and much more. It's an extremely comprehensive server, self-sufficient. But since Home Assistant offers a very well-designed energy chart, I wanted to be able to integrate the WES server into this home automation system. This guide will help you do the same. Prerequisites You'll of course need a working WES server connected to the network, as well as a working Home Assistant installation.
First of all, to keep my Home Assistant configuration file from getting overloaded, I split it into several files, something the developers originally provided. Here we will have two files:
sensors.yaml, which will contain the configuration of all WES sensors
customize.yaml, which will allow you to customize these sensors so that they are correctly recognized by the Home Assistant Energy table
- To do this, simply add these lines to the configuration.yaml file if you don't already have them:
- sensor: !include sensors.yaml
#Customizing Home Assistant
homeassistant:

customize: !include customize.yaml
Creating WES server sensors in Home Assistant
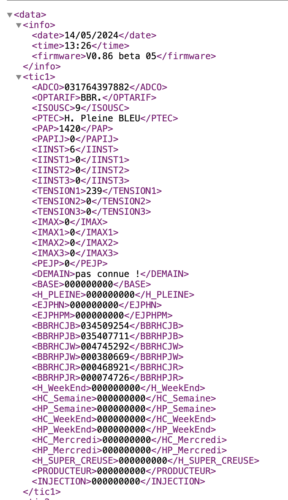
    Unfortunately, the WES server doesn't offer an MQTT connection, although it's been announced for several years now. It's a shame, because it would have made our lives much easier. However, WES does provide several files for reading the information it collects. The most comprehensive file is undoubtedly data.cgx, available at http://IP_DU_WES/data.cgx . This is the one we'll use to avoid having to switch between multiple files.
It groups all the useful information in this format:
We simply need to declare the various desired information in Home Assistant. To do this, in the sensors.yaml file (create it in your homeassistant directory if you don't already have it), we need to declare the connection to the WES server:
– platform: rest
name: wesdata
#Replace with your WES server IP
  resource: http://
    IP_DU_WES
/data.cgx
    scan_interval: 60method: GETauthentication: basic
    #Replace with your system username and password
    username:
    admin
password:
    wes json_attributes_path: "$.data"
    json_attributes: - "tic1"
    - "tic2"
    - "tic3"
      - "pulse"
      - "clamp"
      - "temp"
      - "relay"
      - "input"
      - "analog"
      - "virtual_switch"
      - "variables"
      value_template: 'OK'
      You will need to replace the fields in red, for Enter the IP address of the WES server, as well as the username and password if you're not using the default ones. You can also change the "scan_interval" to query the file more or less frequently. Here, it's set to query every minute, which is fine for most uses. There's no need to overload the server with repeated calls.
      Next, the declaration of the various sensors. To read the electricity meter information via Teleinfo, if, for example, you have a peak/off-peak subscription:
    westic1hp:
friendly_name: “Peak Hours Index”
unique_id: westic1hp
       device_class: energy
        unit_of_measurement: 'Wh'
        value_template: >-
        {{ states.sensor.wesdata.attributes| float }}
        westic1hc:
        friendly_name: "Off-peak Index"
["tic1"]            unique_id: westic1hc["H_PLEINE"]
       device_class: energy
        unit_of_measurement: 'Wh'
        value_template: >-
        {{ states.sensor.wesdata.attributes| float }}
        You can customize the "friendly_name" fields if you wish: these are the names that will appear in Home Assistant. The rest should remain unchanged. If you're like me with a Tempo subscription, there will be a few more sensors to create:
        #If Tempo subscription
["tic1"]            westic1bleuhp:["H_CREUSE"]
friendly_name: “Blue Peak Hours Index”
unique_id: westic1bleuhp
device_class: energy
        unit_of_measurement: 'Wh'
          value_template: >-
          {{ states.sensor.wesdata.attributes | float }}
          westic1bleuhc:
          friendly_name: "Blue Off-Peak Hours Index"
          unique_id: westic1bleuhc
["tic1"]           device_class: energy["BBRHPJB"]

        unit_of_measurement: 'Wh'
          value_template: >-
          {{ states.sensor.wesdata.attributes| float }}
          westic1blanchp:
          friendly_name: "White Peak Hours Index"
          unique_id: westic1blanchp
["tic1"]               device_class: energy["BBRHCJB"]
        unit_of_measurement: 'Wh'
          value_template: >-
          {{ states.sensor.wesdata.attributes | float }}
          westic1blanchc:
          friendly_name: "White Off-peak Hours Index"
          unique_id: westic1blanchc
["tic1"]               device_class: energy["BBRHPJW"]
        unit_of_measurement: 'Wh'
          value_template: >-
          {{ states.sensor.wesdata.attributes| float }}
          westic1rougehp:
          friendly_name: "Red Peak Hours Index"
          unique_id: westic1rougehp
["tic1"]               device_class: energy["BBRHCJW"]
        unit_of_measurement: 'Wh'
          value_template: >-
          {{ states.sensor.wesdata.attributes | float }}
          westic1rougehc:
          friendly_name: "Red Off-peak Hours Index"
          unique_id: westic1rougehc
["tic1"]               device_class: energy["BBRHPJR"]
        unit_of_measurement: 'Wh'
          value_template: >-
          {{ states.sensor.wesdata.attributes| float }}
          You can also retrieve information related to injection (if you have an energy production contract), instantaneous consumption, or voltage:
          westic1inj:
          friendly_name: "Injection Index"
["tic1"]               unique_id: westic1inj["BBRHCJR"]
device_class: energy
        unit_of_measurement: 'Wh'
          value_template: >-
          {{ states.sensor.wesdata.attributes| float }}
          westic1pap:
          friendly_name: "Instantaneous Consumption"
          unique_id: westic1pap
["tic1"]               device_class: apparent_power["INJECTION"]

        unit_of_measurement: 'VA'
          value_template: >-
          {{ states.sensor.wesdata.attributes| float }}
          westic1tension:
          friendly_name: "Consumption Voltage"
          unique_id: westic1tension
["tic1"]               device_class: power["PAP"]
        unit_of_measurement: 'V'
          value_template: >-
          {{ states.sensor.wesdata.attributes| float }}
          At home, I have a second Linky meter for reselling my solar production (100% resale contract). Since the WES server is also connected to this meter, I can retrieve my production information from it:
          #Second TIC meter used here for photovoltaic production
          westic2prod:
["tic1"]               friendly_name: "Production Index"  ["TENSION1"]
unique_id: westic2prod
device_class: energy
        unit_of_measurement: 'Wh'
          value_template: >-
          {{ states.sensor.wesdata.attributes| float }}
          westic2pap:
          friendly_name: "Instantaneous Consumption"
          unique_id: westic2pap
["tic2"]              device_class: apparent_power["PRODUCTEUR"]
        unit_of_measurement: 'VA'
          value_template: >-
          {{ states.sensor.wesdata.attributes| float }}
          westic2tension:
          friendly_name: "Tension Production"
          unique_id: westic2tension
["tic2"]               device_class: power              ["PAP"]
        unit_of_measurement: 'V'
          value_template: >-
          {{ states.sensor.wesdata.attributes| float }}
          I added another sensor that allows me to get the status of off-peak hours: if westic1tarif = 1, then we are in off-peak hours. This is very useful data in scenarios, for example, to trigger certain machines only when we're at the economy rate :)
          # Sensor to determine if we're in off-peak hours
          westic1tarif:
["tic2"]               friendly_name: "Current Rate"     ["TENSION1"]
unique_id: westic1tarif
value_template: >-
        {{ states.sensor.wesdata.attributes }}
          wesheurecreuse:
          friendly_name: "Off-peak Hours"
          unique_id: wesheurecreuse
["tic1"]           value_template: >-["PTEC"]
        {% if "creuse" in states.sensor.wesdata.attributes.lower() %}
          1
          {% else %}
          0
["tic1"]            {% endif %}["PTEC"]
                In addition to reading ICT (teleinfo), the WES is also capable of monitoring the consumption of four separate power lines using ampere clamp meters. For example, you can monitor the consumption of your water heater, your electric vehicle charging station, your heating system, etc. Use this code:
            #Metric ampere clamp meters to monitor specific items
                wespince1inst:
            friendly_name: "Instantaneous Water Heater"
unique_id: wespince1inst
device_class: current
        unit_of_measurement: 'A'
          value_template: >-
          {{ states.sensor.wesdata.attributes| float }}
          wespince1total:
          friendly_name: "Water Heater Total"
          unique_id: wespince1total
["pince"]               device_class: energy["I1"]
        unit_of_measurement: 'kWh'
          value_template: >-
          {{ states.sensor.wesdata.attributes| float }}
          wespince1watt:
          friendly_name: "Water Heater Consumption"
          unique_id: wespince1watt
["pince"]               device_class: power["INDEX1"]
        unit_of_measurement: 'W'
          value_template: >-
          By default, WES only reports the instantaneous consumption in amps and the consumption index. Since I also wanted to have the instantaneous consumption in watts, I added a small calculation to obtain "wespince1watt". You can modify the "friendly_name" to use a name that suits your needs. If you're using all four possible clamps, simply duplicate this code (I've provided the full code in the downloadable file below).
          The WES server also has pulse meters, which can be used for various purposes, such as tracking water or gas consumption. In my case, the first sensor is used to track my water meter:
          #Pulse sensors, used for water or gas, for example
          wesimpulsion1:
friendly_name: “Water Meter”
unique_id: wesimpulsion1 device_class: waterunit_of_measurement: ‘L'
value_template: >-
{{ states.sensor.wesdata.attributes| float }}
Depending on your usage, you'll need to customize the name, as well as the "device_class" and "unit_of_measurement." You'll find a definition of the different possible values here.
Other information can be retrieved, depending on what's connected to the WES. This includes the temperature reading (up to 30 sensors!) via this code:
#Temperature sensors, possible up to 30
wessonde1:
friendly_name: "Living Room"
["impulsion"] unique_id: wessonde1 ["INDEX1"]device_class: temperature unit_of_measurement: ‘°C'value_template: >-
{{ states.sensor.wesdata.attributes| float }}
Or the relay status:
        #Relays
          wesrelai1:
          friendly_name: "Relay 1"
          unique_id: wesrelai1
          value_template: >-
          {{ states.sensor.wesdata.attributes| float }}
["temp"]             wesrelai2: ["SONDE1"]
friendly_name: “Relay 2”
unique_id: wesrelai2
       value_template: >-
        {{ states.sensor.wesdata.attributes| float }}
        We also have analog inputs, virtual switches, and variables.
        You will find the complete code in this file, with the correct indentation and comments to help you navigate.
["relais"]             Download the sensors.yaml file  ["RELAIS1"]
       Adjust according to your needs, of course. Personally, I only use the two TIC meters, the four ampere clamps, and a pulse meter. Once your configuration is saved, you'll need to go to "Developer Tools" and click "Verify Configuration" to ensure there are no problems with the file syntax.
        If everything is correct, all that's left to do is click restart.
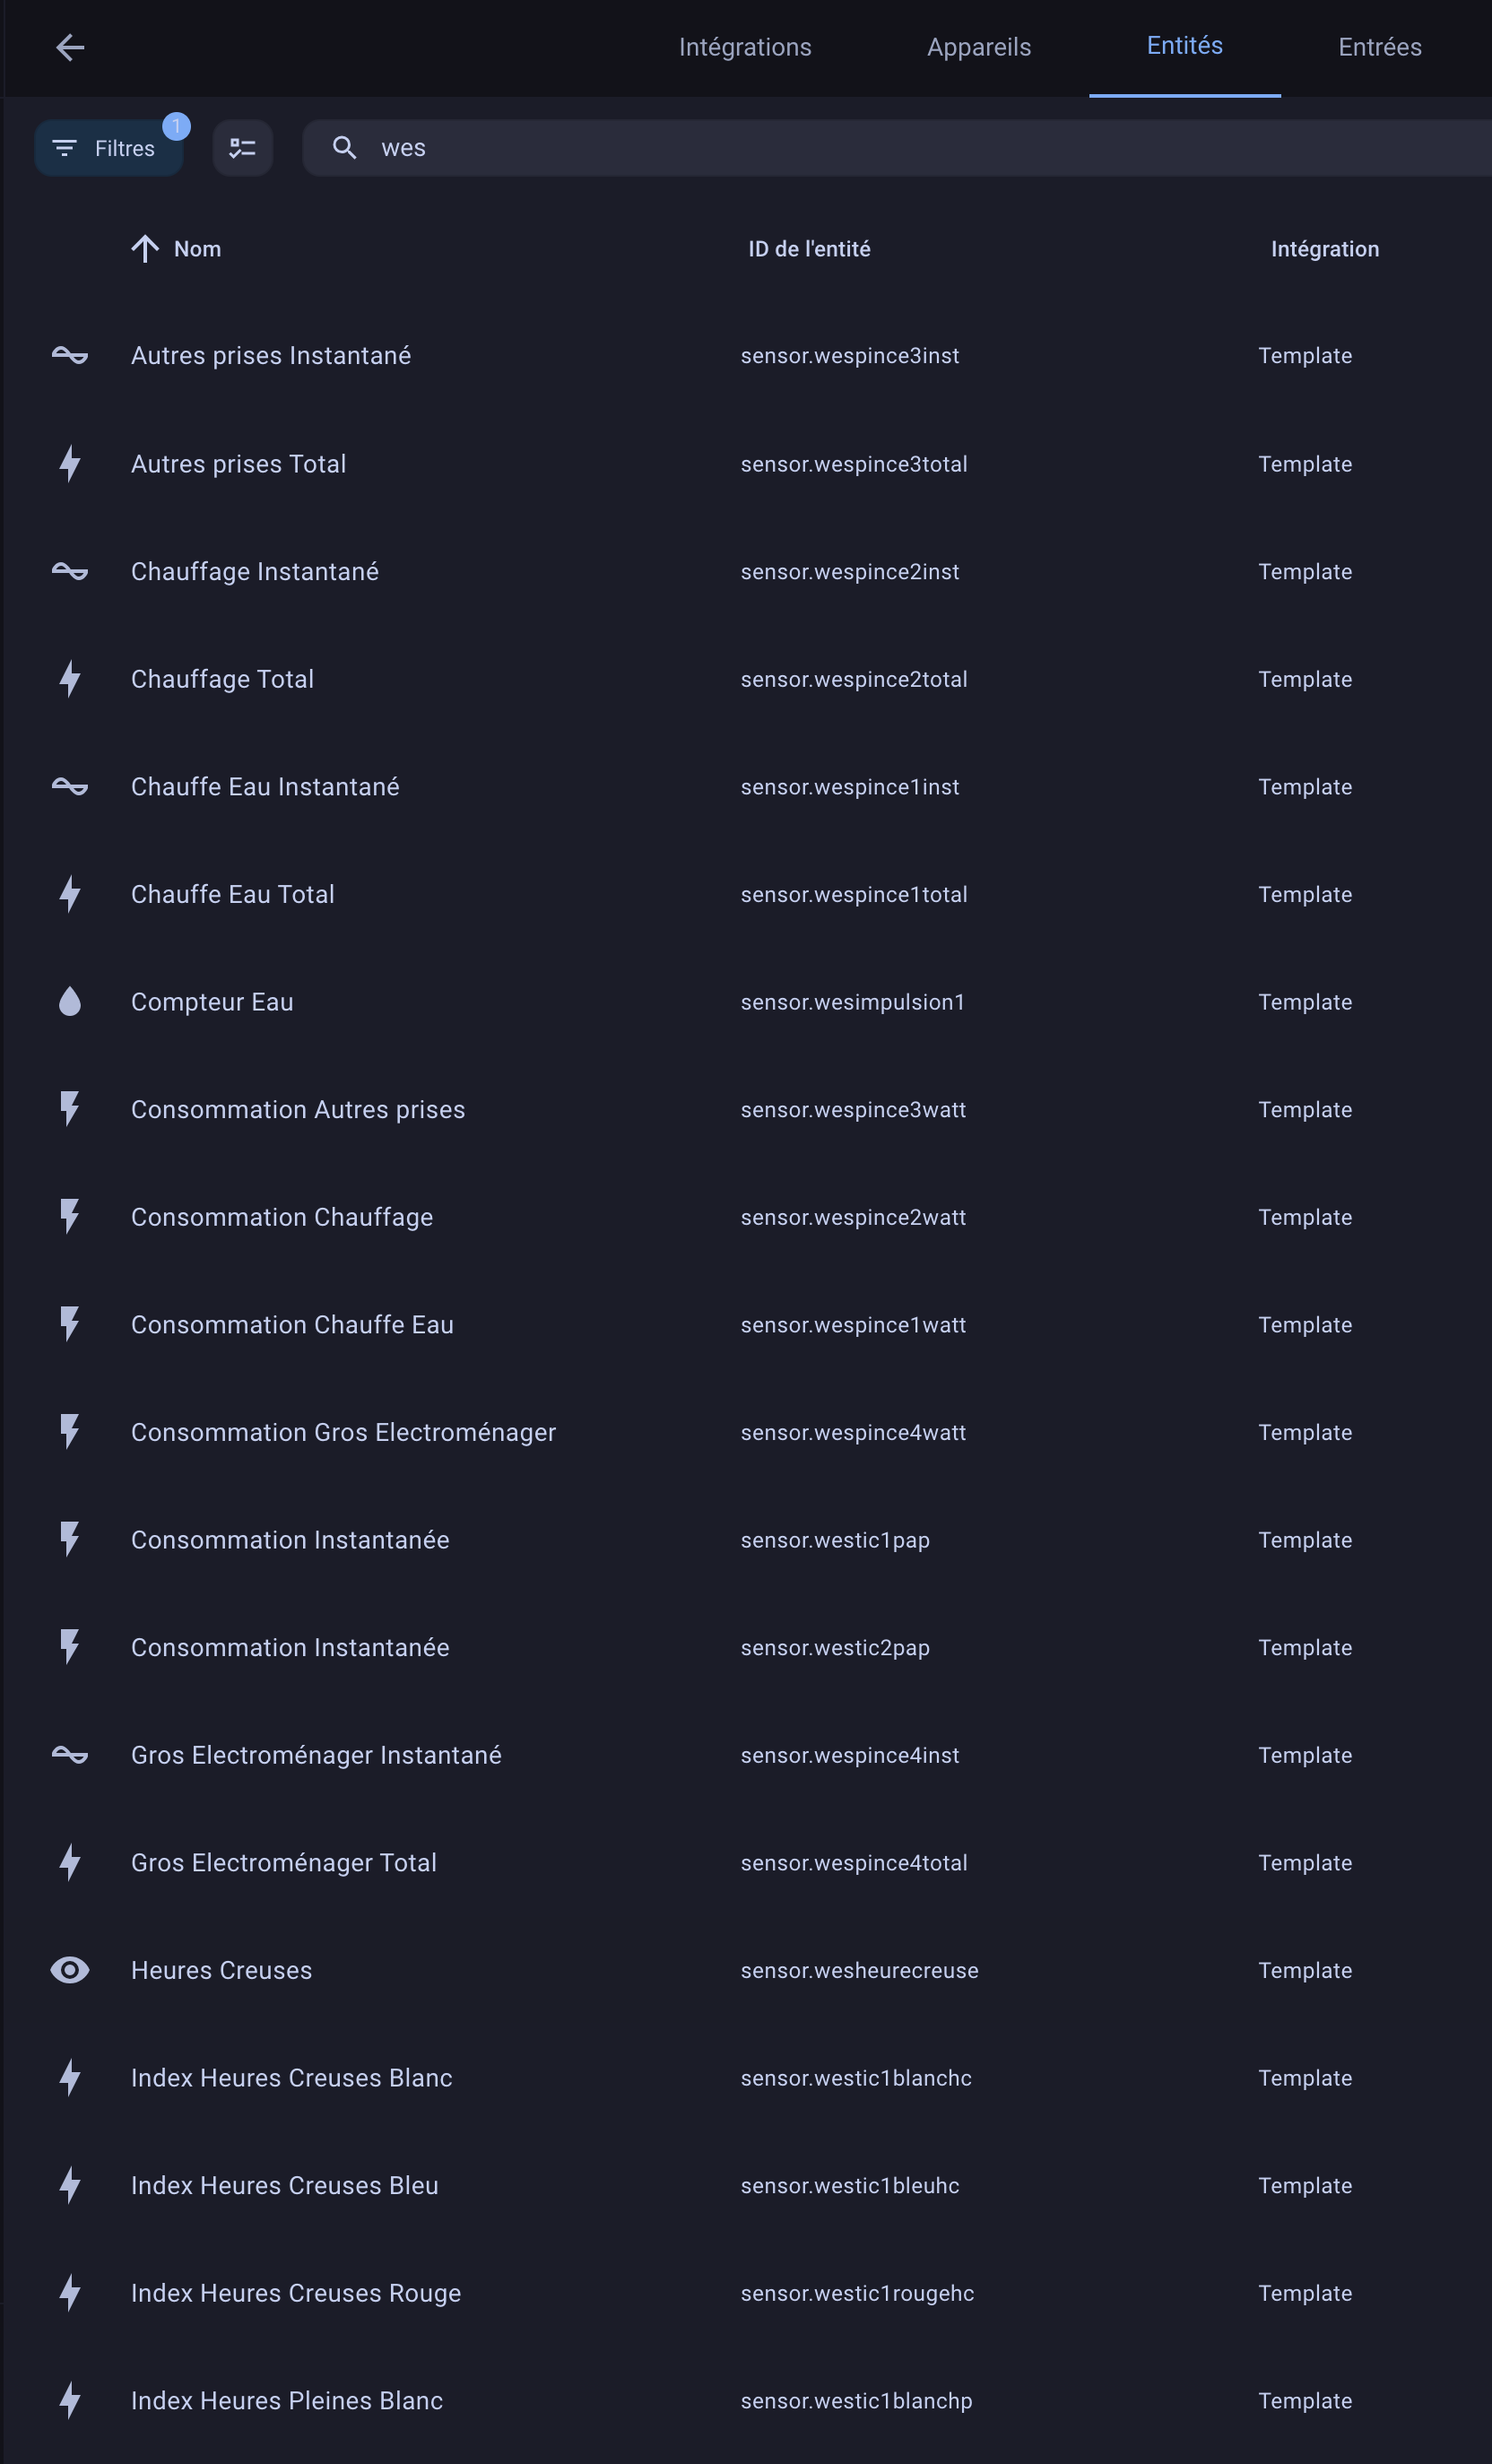
        Once Home Assistant has restarted, if you go to Settings / Devices and Services / Entities and type "wes" in the search bar, you should find all the sensors created for WES:
        From there, you can use them to trigger scenarios, create consumption monitoring dashboards, etc.
["relais"]             BUT you can't use them in Home Assistant's Energy dashboard yet.  ["RELAIS2"]
Integrate WES into Home Assistant's Energy Dashboard
Home Assistant's Energy dashboard is really well done. But it only accepts indexes or total consumption meters. One might think this is good for WES, since we've created sensors for indexes. Except that to appear in the list of compatible devices in the Energy dashboard, these sensors must have a “state_class: total” argument. While this argument can be included directly in the MQTT sensor configuration, this isn't the case for the sensors created here for WES, since we're dealing with REST calls, not MQTT calls. Fortunately, we can modify the sensor declaration in a customize.yaml file by adding this type of code for each sensor representing total consumption:
state_class: total
device:

identifiers: “WES Server”
name: “WES Server”
model: “WES”
manufacturer: “Cartelectronic”
I'll leave my complete file here:
Download the customize.yaml file
Simply place it in the homeassistant directory, then restart Home Assistant again (after verifying that the code is correct).
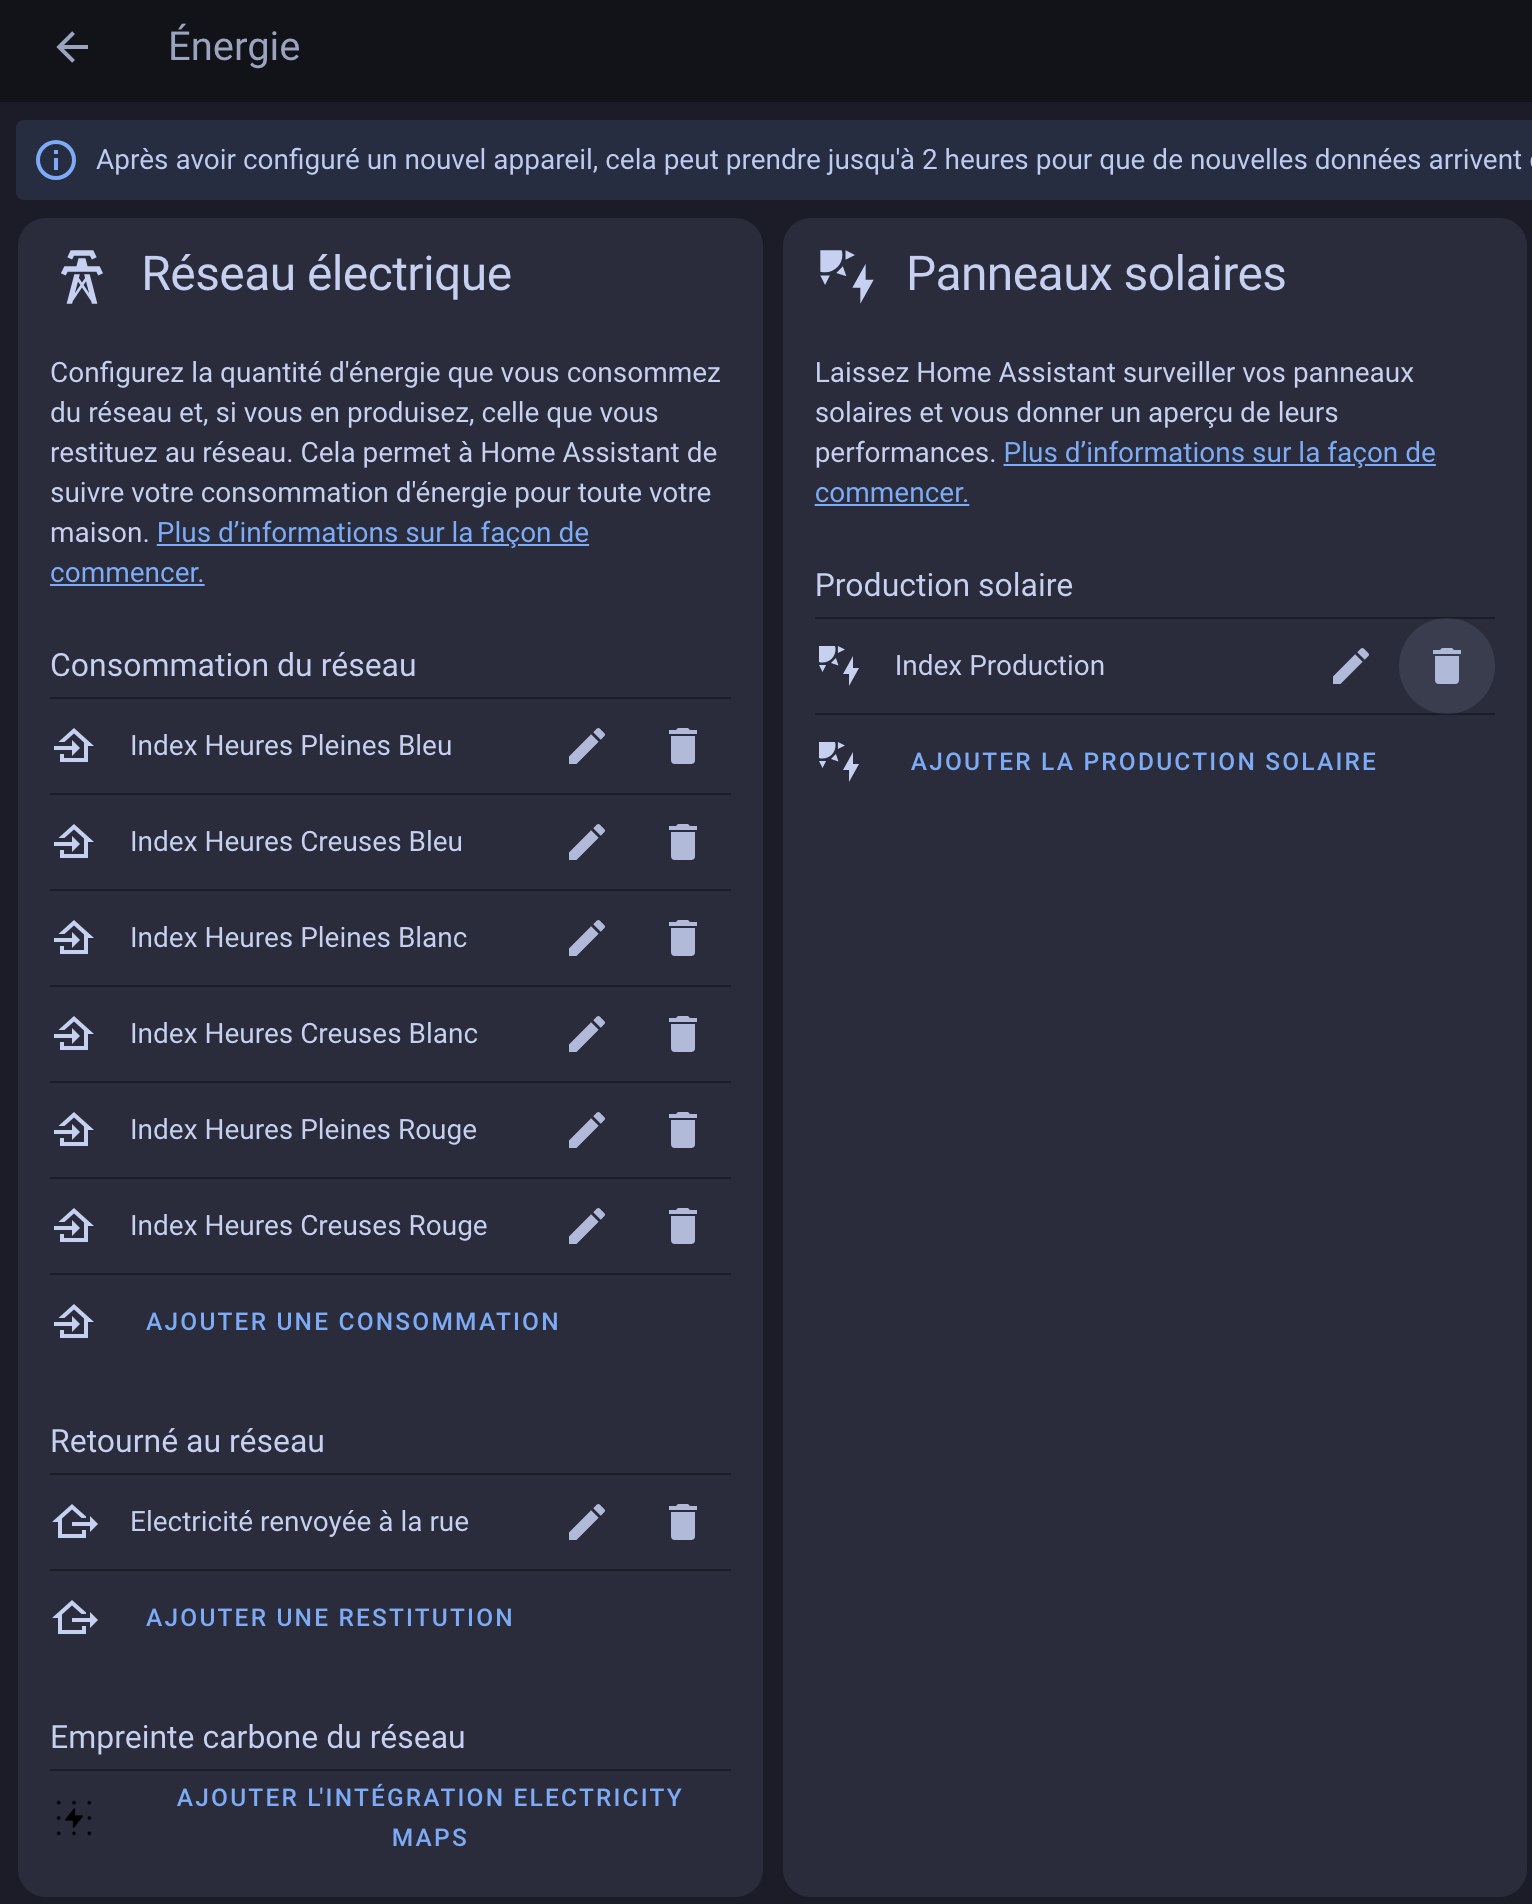
We can then finally add our various indexes to the Energy dashboard, whether for teleinfo, consumption, production, water consumption, etc.
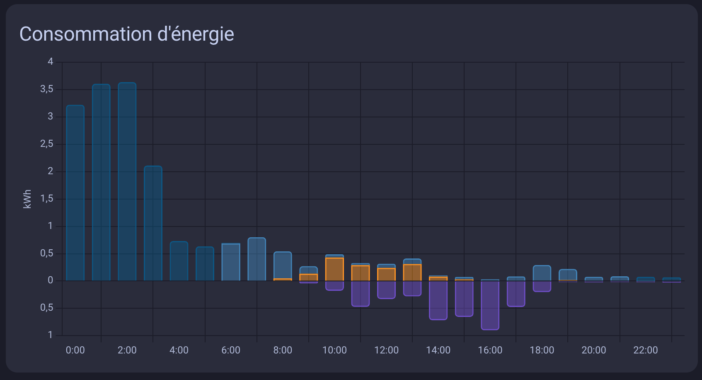
  After a while, we have our consumption monitoring, with the details for off-peak and peak hours (in lighter blue). I also have my photovoltaic production tracking in yellow:
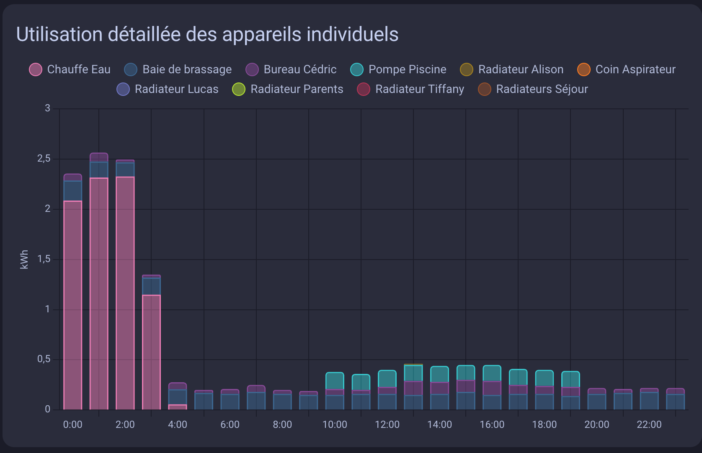
  Similarly, I find my water heater's consumption tracking, among the other individual devices:
    And there you have it!
    Conclusion
    Gradually migrating my home automation system to Home Assistant, I spent quite some time searching for ways to integrate my WES server, because unlike Jeedom, it doesn't have a ready-to-use plugin on Home Assistant. Several topics deal with this, including:
    a
post on the WES manufacturer's forum
a
post on the HACF forum
The Home Assistant documentation also provides a better understanding of how REST sensors work.
Native MQTT compatibility would have made things much easier, but ultimately, we're able to retrieve all the WES data, which can be used perfectly in Home Assistant—that's the main thing. The integration has been working for me for a little over a month now, with no issues to report. I'm able to use my WES, which saves me from having to multiply the sensors, since it handles so many things natively. This guide might help some of you who, like me, were looking for a way to do this!




Please remain courteous: a hello and a thank you cost nothing! We're here to exchange ideas in a constructive way. Trolls will be deleted.